1D signal presentation in Icy
Motivation
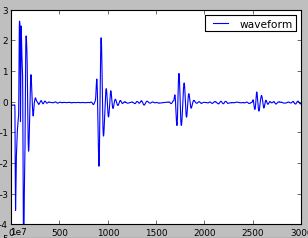
Icy is designed for 2D+ image data processing, but in NDE, we often get 1D signal like ultrasonic waveform. The following picture shows a sample of typical ultrasonic waveform.
Solution
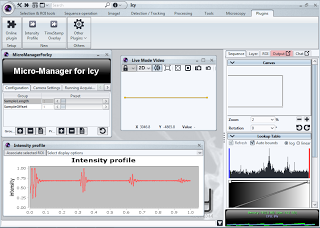
But there are a lot of plugins available on the Icy repository, and a user can alway find something they want. So I found the "Intensity Profile" plugin which can used a a temporary solution to show a waveform in Icy. The following picture shows the screen shot of using intensity profile to show a waveform stored as a picture with only one row pixels.
Usage: 1. Input "IntensityProfile" in the search bar of Icy, it located in the upper left of the main window. When it appears in the search result, just click to install. 2. Open you image, we can store a waveform as a row of pixels, which also means one pixels is one sample value from your data acquisition device. Don't care much about the data range, Icy supports 32-bit gray image, which will be enough for most ADC device. 3. Then put a line ROI on the image, adjust it to the right position, you can press shift key to make it orthogonal. 4. Click "IntensityProfile" in the menu bar. And you will see a cure displayed in a chart window. You can zoom in and out, the chart is handled by a java chart library known as "JfreeChart".

